Investment Thesis
NETSTREIT (NYSE:NTST) is worth holding as the Company operates within the resilient property sector and has:
- Strong business metrics in terms of occupancy rate and WALT
- well-covered dividends with a low AFFO payout ratio
- no debt maturing until 2027
- reasonable valuation
- strong, investment-grade tenants, and
- track record of impressive AFFO per share growth.
However, the above factors are not unique and there are some entities operating within the same property sector that share them. I will refer to them in the following sections. Moreover, they don’t share the weaknesses of NTST:
- Low investment spreads,
- high tenant concentration,
- negligible dividend growth, and
- little upside potential resulting from the multiple appreciation.
Therefore, I believe that there are more attractive opportunities within the retail/service-oriented property sector. Within the analysis, I provided a few examples supported by a comparison of some key metrics.
Considering the above factors, NTST is a “hold” for me.
Introduction
In my recent analysis of NTST, I gave it a “hold” rating. The Company definitely has some strong points; however, a few factors prevent me from perceiving it as an attractive investment opportunity. Since then, its stock price has been relatively flat and currently stands at a ~0.4% higher level than as of the publication date. Please refer to the link provided below to get a better grasp on the development of my take on NTST. Without further ado, let’s review its business – enjoy the read!
Netstreit: There Are More Attractive Opportunities Given Its Valuation
Seeking Alpha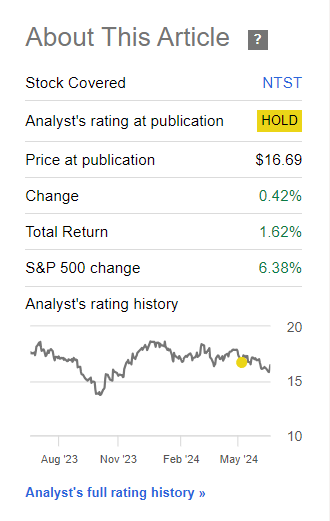
NTST – The Bright Side Of A Coin
NTST is a relatively small REIT when compared to some of its competitors like:
As of March 2024, NTST owned 628 properties, which is ~3 times less than the smallest of the above entities – EPRT. It operates within a property sector favoured by investors due to its resilience to economic conditions and continuous digitization – retail/service-oriented properties.
NTST’s Investor Presentation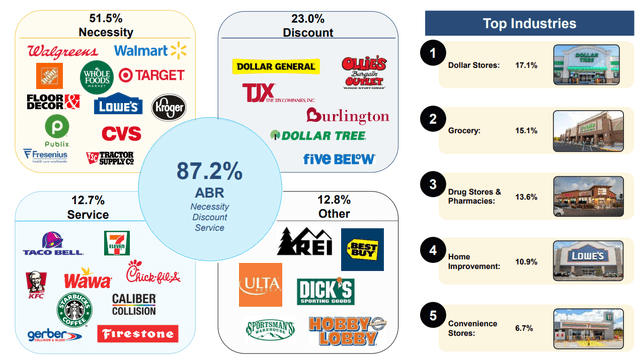
Around 71.1% of its ABR is derived from investment-grade tenants, and 9 out of 10 of its largest tenants have investment-grade ratings ranging from BBB to A. According to its latest results, some of NTST’s business metrics stood at impressive levels. Naturally, investors may recognize the quality of a portfolio, the negotiating strength, and the ability to source attractive investment opportunities of a given REIT based on such metrics.
Excluding 74 investments that secure mortgage loan receivables, NTST’s portfolio recorded a 100% occupancy rate, which is solid when compared to its peers. For reference, the metric stood at:
- 99.6% for ADC
- 99.9% for EPRT
- 99.4% for NNN
NTST is also capable of securing long lease terms, which resulted in a weighted average lease term (WALT) of 9.2 as of March 2024. While it compares well with ADC’s 8.2 years or NNN’s 10.0 years, there’s a significant advantage of EPRT, which holds one of the best WALTs in the entire sector – 14.1 years.
Moreover, NTST had a safe financing structure with no debt maturities until 2027, which ensures the limited impact of the high interest rate environment on its financial performance. However, the impact is present as ~11% of its debt is a floating-rate debt. NTST’s fixed charge coverage ratio was in line with its peers. The metric that stands out (in a negative way) is a low weighted average maturity term of just 3.9 years. ADC’s level of 7 years or NNN’s level of 11.8 years is much more reassuring for me.
There Are Better Alternatives – Here’s Why
#1 Lower spreads on investments
Let’s stick to the peer group defined earlier (ADC, EPRT, and NNN). In order to estimate an investment spread for each of the entities, we need to estimate their cap rates and costs of capital (WACC, which stands for weighted average cost of capital). Beginning with the cost of equity can be estimated by dividing the company’s AFFO per share by its share price.
For example, with NTST’s AFFO per share guidance for 2024 (on midpoint) of $1.27 and its recent share price of $16.76, its cost of equity can be estimated at ~7.5%. Analogically for the rest of the entities.
Regarding the cost of debt, I’ve estimated it based on each REIT’s credit rating. As for NTST, which doesn’t have a credit rating, I assumed a slightly higher cost of debt than assigned to the peer group (just slightly, not to be subjective and base my case solely on that).
Cap rates were derived from each entity’s most recent 10-Q / Investor Presentations for Q1 2024. For details, please refer to the table below.
Author based on Seeking Alpha and SEC filings of ADC, NTST, EPRT, and NNN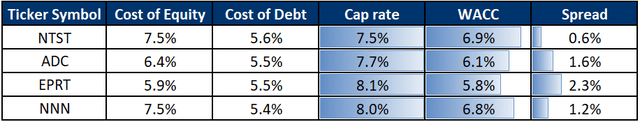
Based on the above assumptions, I believe ADC, EPRT, and NNN to generate noticeably better spreads on their investments. Therefore, that is one of the factors that makes NTST less attractive when compared to its competitors.
#2 Negligible dividend growth
NTST offers an attractive dividend yield of ~5%, which is also well-covered as the forward-looking AFFO payout ratio stands at ~65.5%. Its AFFO per share recorded an impressive growth rate during the 2021 – 2023 period and is expected to grow by ~3.7% at the midpoint in 2024 on a year-over-year basis. Due to the Company’s relatively small size allowing for each acquisition to significantly impact its bottom line, NTST’s AFFO per share marked a CAGR of ~20.9% during the 2021 – 2023 period (with 2020 as a base year). For details, please refer to the table below with AFFO per share of NTST and its peer group.
Despite the impressive AFFO per share development, the dividend saw negligible growth during the period. Naturally, dividends are a matter of capital allocation. Therefore, that is not necessarily a negative side of NTST, and some investors may not be bothered. However, I believe that more income-oriented investors would like to see some dividend growth over the years. That included me, thus, I perceive this as a factor making NTST less attractive compared to its competitors.
NTST website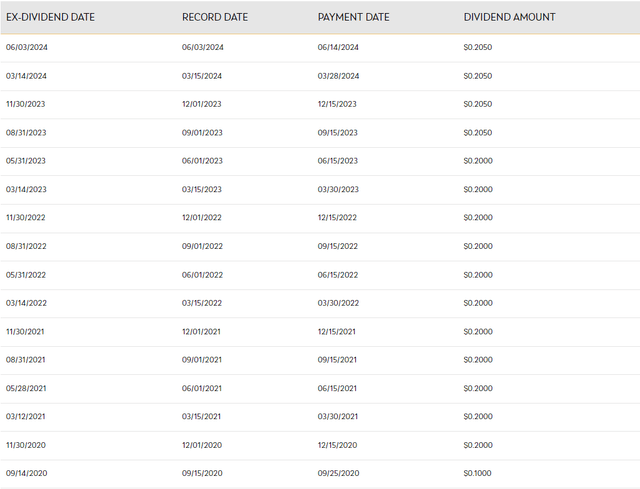
#3 Tenant concentration
NTST’s tenant structure is relatively concentrated. The factor limiting the risks associated with that is that most of them have investment-grade balance sheets with credit ratings ranging from BBB- to A. Nevertheless, ~52.3% of the Company’s ABR was derived from its Top 10 tenants, which is significantly higher than in the case of ADC or EPRT. For reference, the Top 10 tenants were responsible for:
- 37% for ADC
- 19.1% for EPRT
NTST’s Investor Presentation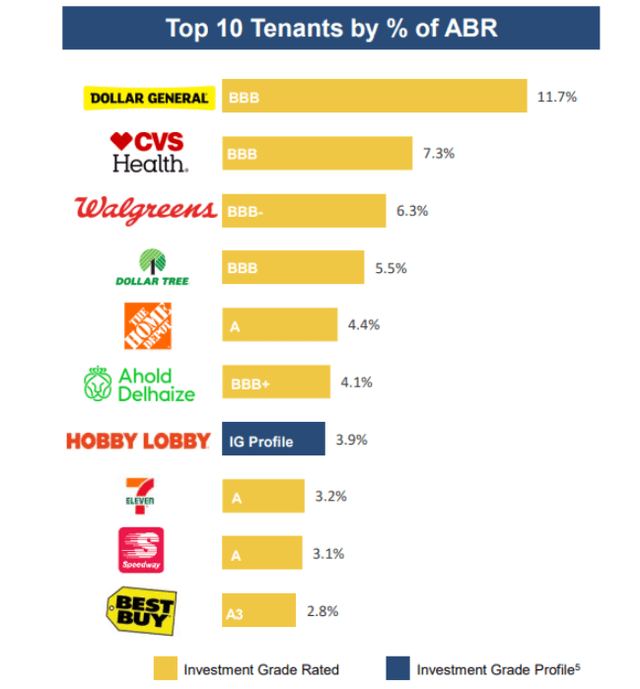
That certainly is a significantly more concentrated tenant structure than what I wish to see. Should any of the most important tenants experience severe issues, it would have a noticeable impact on NTST’s financial performance. Such risk is less prominent for NTST’s competitors, such as ADC or EPRT, therefore, they present themselves as more attractive, safer investment opportunities than NTST.
Valuation Outlook
As an M&A advisor, I usually rely on a multiple valuation method that is a leading tool in transaction processes, as it allows for accessible and market-driven benchmarking. However, this method doesn’t just involve gathering the metrics. The most crucial element of valuation is understanding the business-related rationale for a given multiple. Without that, investors won’t be able to assess the market data appropriately.
With that said, please review the forward-looking P/FFO multiple for NTST and its competitors below:
- 13.5x for NTST
- 15.6x for ADC
- 15.3x for EPRT
- 13.3x for NNN
I believe that ADC, EPRT, and NNN are better-quality REITs than NTST; therefore, they should enjoy higher multiples. Each of these entities has top-tier business metrics, better credit metrics, higher investment spreads, and attractive growth prospects. At the same time, they are not subject to the tenant structure risk to the same degree as NTST, and they provided impressive dividend growth over the years. Stating simply – the “bad sides” of NTST don’t apply to its competitors, while they share and exceed (in some cases) its strengths.
Naturally, REIT valuations are sensitive to the FED policy, so any major shifts could heavily impact the valuation. With no major shifts in the market conditions or any other material adverse changes, I consider NTST to be well-suited for a P/FFO multiple ranging from 13.0x to 14.0x. At the same time, I believe its competitors will enjoy multiple appreciation. Should the economy continue to move in a positive direction, I believe that ADC, EPRT, and NNN will experience more upside than NTST.
Key Takeaways
Strengths & Opportunities
- High occupancy rate,
- solid WALT,
- strong tenants with a majority of them having investment-grade balance sheets,
- favourable property sector resilient to the “Amazon effect” and economic turmoils,
- impressive AFFO per share growth,
- reasonable valuation,
- attractive yield of well-covered dividends, and
- no debt maturities until 2027.
Weaknesses & Risk Factors
- Lower investment spreads when compared to its competitors,
- negligible dividend growth,
- high tenant concentration, which magnifies the negative impact of any potential tenant issues,
- limited upside potential resulting from the multiple appreciation,
- low weighted average debt maturity term, and
- should the high interest rate environment remain, the Company’s financial performance will be impacted by its floating-rated debt and possibly higher refinancing costs if such conditions are upheld until 2027.
Read the full article here